Extract biological insights from spatially‑resolved multiomic data.
Propath Spatial Data Analysis Service empowers researchers and clinical teams to decode biological processes through integration of high‑resolution multiomic datasets.
Leveraging in-house workflows in a GCP‑validated environment, we provide robust, reproducible and regulatory‑ready analyses suitable for both exploratory research and clinical trial environments.


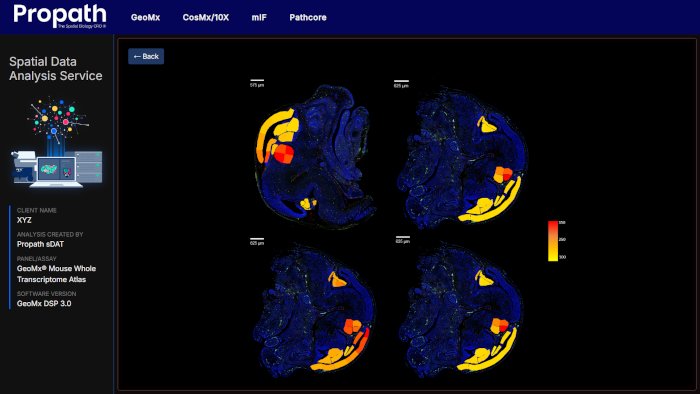
Propath's interactive report
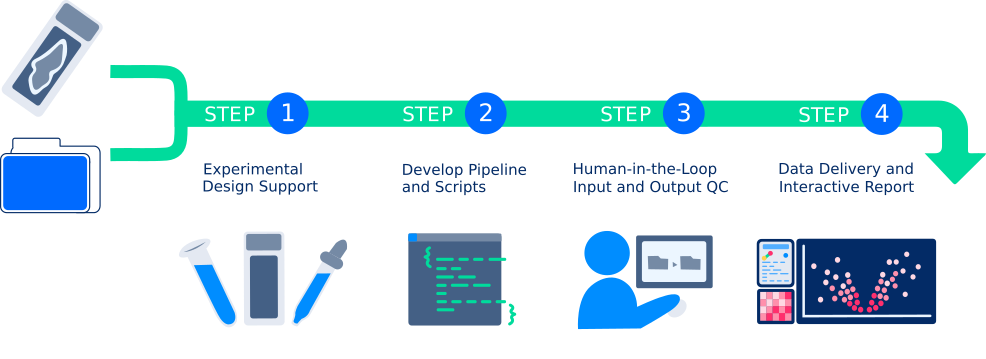
Propath offers a range of predeveloped analysis packages and standardised outputs tailored to the analyte and data type. Packages may also be customised, multiple methodologies integrated or fully bespoke scripting developed on request.
Propath’s team of experienced data scientists work interactively to advise laboratory experimental design and to build routine data pipelines or bespoke solutions, providing robust and reproducible analyses and presenting them accessibly for the relevant stakeholders in support of each step of your pathway, from discovery to clinical trials.
Propath's platform for quantitative image analysis and bioinformatics has been designed and validated to be fit-for-purpose for use on clinical trial data.
Our controlled environment ensures analyses are conducted according to the principles of informed consent, data integrity, confidentiality and scientific rigour to maintain GCP compliance from sample receipt to data delivery.
Our experience across a range of platforms for spatial biology allows us to recommend the most appropriate platform for each research project.
We understand the strengths and limitations of each platform – and how to get the best out of them.